
Last Updated: August 11, 2026


About the Variance Report
The Variance Report compares your actual physical stock against your expected theoretical stock over a chosen period.
While minor variances, like a dropped plate or a spilled drink, are normal, the Variance Report highlights large or recurring discrepancies.
By showing your Theoretical Stock on Hand (TSoH) right next to your physical counts, it helps you quickly pinpoint potential theft, over pouring, or process gaps.
Before you begin
The report calculates your variances based on all incoming and outgoing stock activity between an opening and closing stocktake.
It relies on your stock movements being accurately recorded in the system, so maintaining correct information is important to ensure reliable results.
Before generating a report, ensure the following are up to date for your selected period:
-
Stocktakes: At least two completed stocktakes
-
Unit Measurements: Units match how the items are invoiced
-
Recipes: Created and ingredient quantities match real life usage
-
POS Integration: Active, with sales linked to recipes
-
Invoices & Credits: Approved all records for the period
-
Requisitions & Transfers: Approved/Delivered all records for the period
-
Wastage Records: Entered all records for the period
-
Production Records: Entered all records for the period, if you use Production Recipes
Generating the Variance Report
-
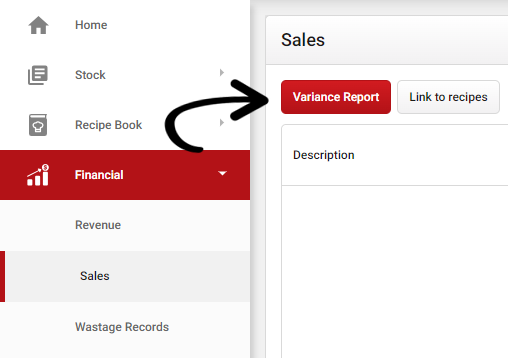
From the navigation bar, go to Financial > Sales
- Select Variance Report
- Select a stocktake for your Start Date and End Date
- Select your Variance Report Settings then Select to generate
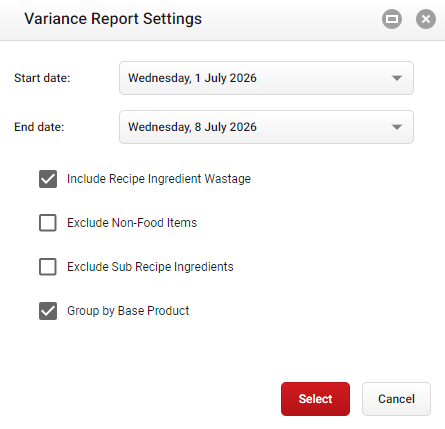
Variance Report Settings
You can adjust these settings at any time after generating the report
- Include Recipes Ingredient Wastage: Whether wastage percentage on recipe ingredients is included in the POS Sales calculation
- Exclude Non-Food/Beverage Items: Hides any items in Stock Maintenance that do not have the Food or Beverage Cost checkbox ticked.
- Exclude Sub Recipe Ingredients: Does not decrement ingredients of sub recipes that are used in recipes linked to POS Sales
- Group by Base Products: Aggregates stock items into their assigned Base Products to view as a single data point.
Understanding the report
Once generated, the report displays a comprehensive breakdown of your stock movement. Use the tables below to understand exactly how each column is calculated.
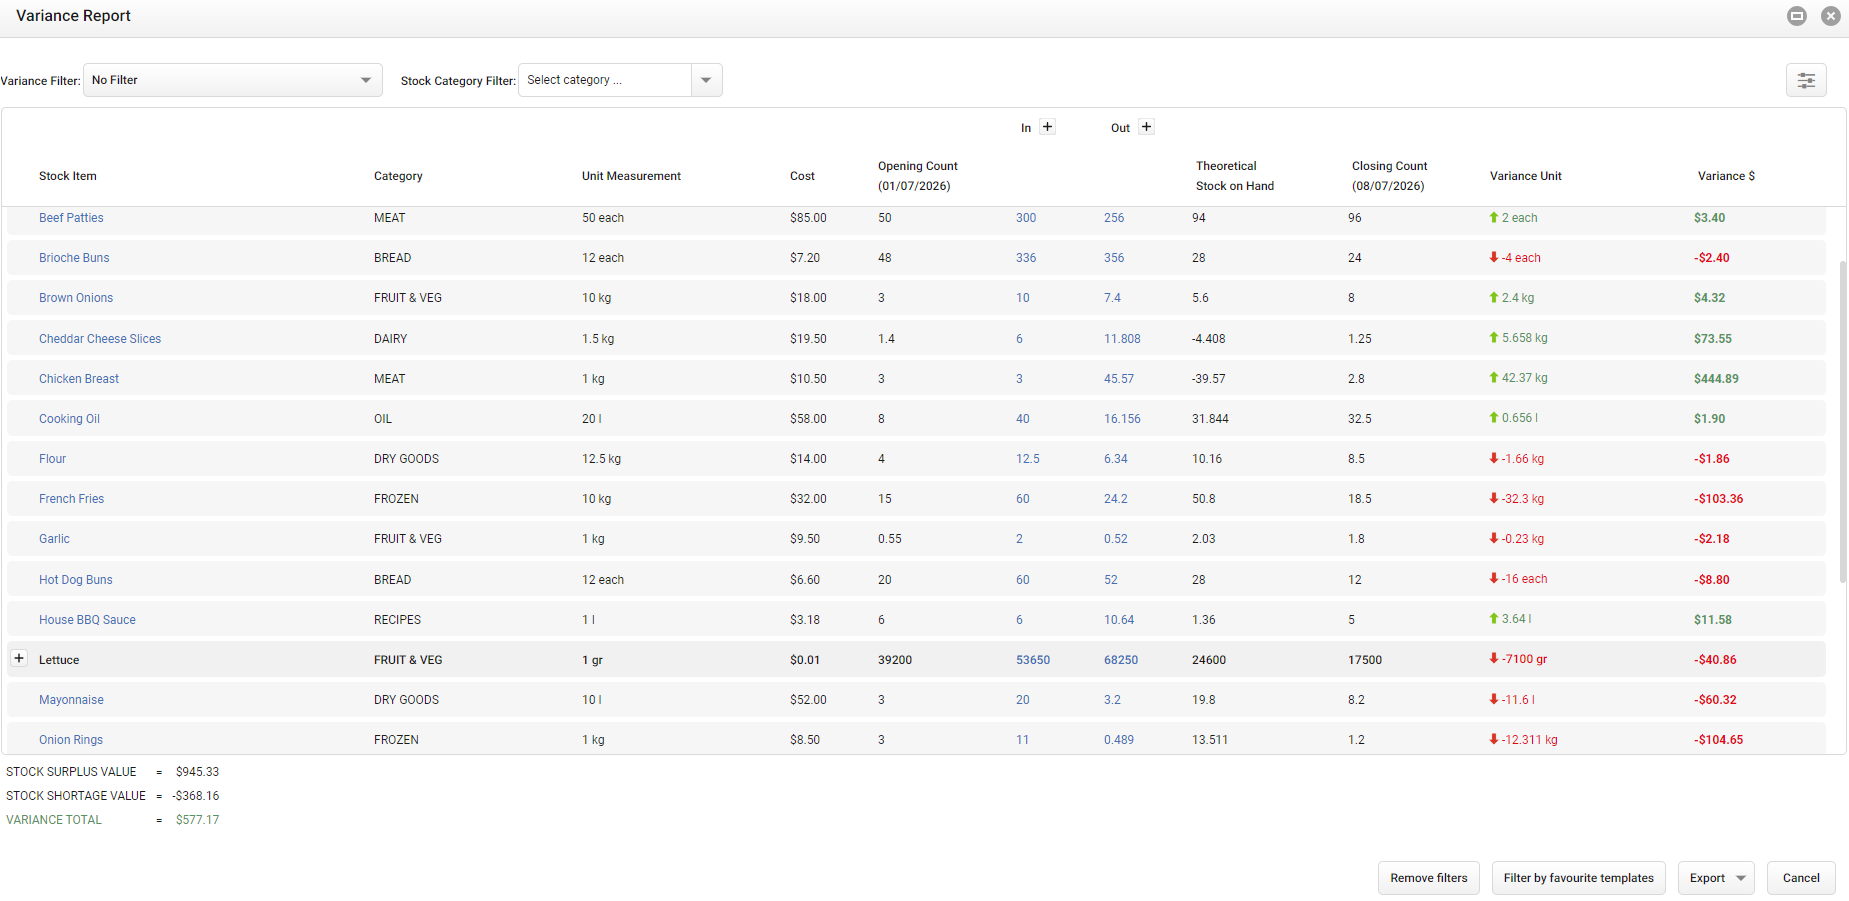
Click image to enlargeClick any value highlighted blue to view more information.
Stocktake timing
The Variance Report calculates data between an opening and closing stocktake, and Stocktakes are considered to be the very first action of the day. Basically, this means your Stocktake time is 12:00AM.
This means, any incoming or outgoing records made on the same day as your stocktake are considered to have happened after the count was completed.
- Opening Stocktake: 1/7
- Closing Stocktake: 8/7
- Included: Stock movement dated 1/7 - 7/7
- Excluded: Stock movement dated 8/7
Column overview

| Column | What it means |
| Stock Item |
The item name. Click the item to see the recipes it is used in which are and aren't linked to POS sales Items in a Base Product appear with a + symbol, see Base Product section for more detail |
| Category | The category assigned to the stock item |
| Unit Measurement |
The unit of measure (UoM) set in Stock Maintenance All values in the variance report are shown in this unit |
| Cost | The current Cost saved in Stock Maintenance |
| Opening Count | Physical count from your opening stocktake |
| In + |
Total incoming stock for the period. Click the + button to expand the column See Incoming Stock (In+) for more detail |
| Out + |
Total outgoing stock for the period. Click + button to expand the column See Outgoing Stock (Out+) for more detail |
| Theoretical Stock on Hand |
Stock quantity you should have Opening Count + In - Out |
| Closing Count | Physical count from your closing stocktake |
| Variance Unit |
Quantity difference between actual and theoretical A green arrow pointing up indicates you have a stock surplus - More stock than expected. A red arrow pointing down indicates you have a stock shortage - Less stock than expected. Closing Count - Theoretical Stock on Hand |
| Variance $ |
Cost difference between actual and theoretical Variance Unit × Cost |
Incoming stock (In+)

The total of all stock that has come into the system for the period.
Expand the section to see what contributed to the total value by selecting the + button.
| Column | What it means |
| Purchases |
Stock received on approved Invoices Click the view contributing invoices |
| Returns |
Stock on approved Credit Notes marked as Returned Goods Click to view contributing credits |
| Requisition In | Stock received on approved Requisitions |
| Transfer In |
Stock received on approved Transfers Click to view contributing transfers |
| Production | Total amount of a Production Item that has been produced via a Production Record, based on Yield Amount. |
Outgoing stock (Out+)

The total of all stock that has left the system for the period.
Expand the section to see what contributed to the total value by selecting the + button.
| Column | What it means |
| POS Sales |
Total amount of the item sold on recipes linked to sales Click to view sale, recipe, portion weight and quantity sold |
| Wastage | Total amount of the item recorded on Wastage Records |
|
Requisition Out |
Stock delivered to another outlet via Requisition |
| Transfer Out |
Stock transferred Out to an internal outlet or external destination on an Approved transfer Excluded transfers in the Sent, Review or Rejected status |
| Production Usage | Amount of stock used in Production Records where this item is an ingredient in a Production Recipe |
Variances
Variances are broken down at both the summary level and stock item level.
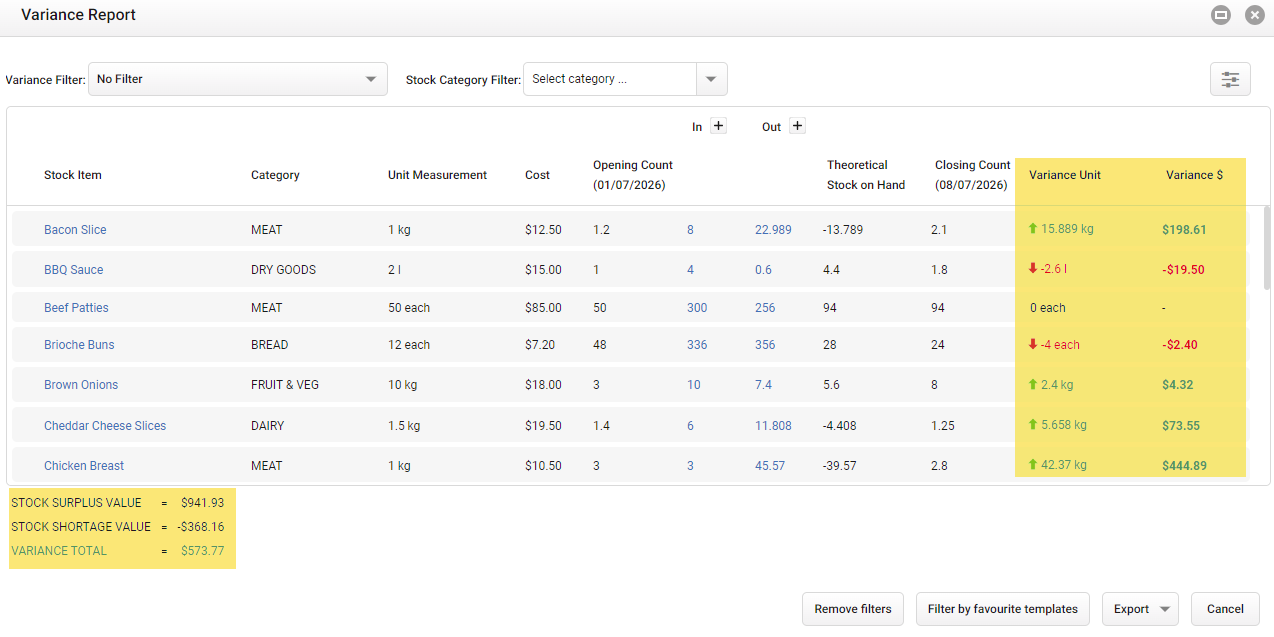
Click image to enlarge Overall Variance Totals are located in the bottom left corner of the report, showing three key metrics
- Stock Surplus Value: The total cost of items with higher stock on hand than expected
- Stock Shortage Value: The total cost of items with lower stock on hand than expected
- Variance Total: The total cost impact of your overall variance, which is Surplus Value - Shortage Value
Individual Stock Item Variances are displayed in the line item detail of the report in the Variance Unit and Variance $ columns
- Surplus (Green ⇧ ): Indicates more stock on hand than expected
- Shortage (Red ⇩ ): Indicates less stock on hand than expected
- No Variance: Shows 0 in the Variance Unit column, and the Variance $ column is left blank
Filters and export options
Customising and exporting your Variance Report
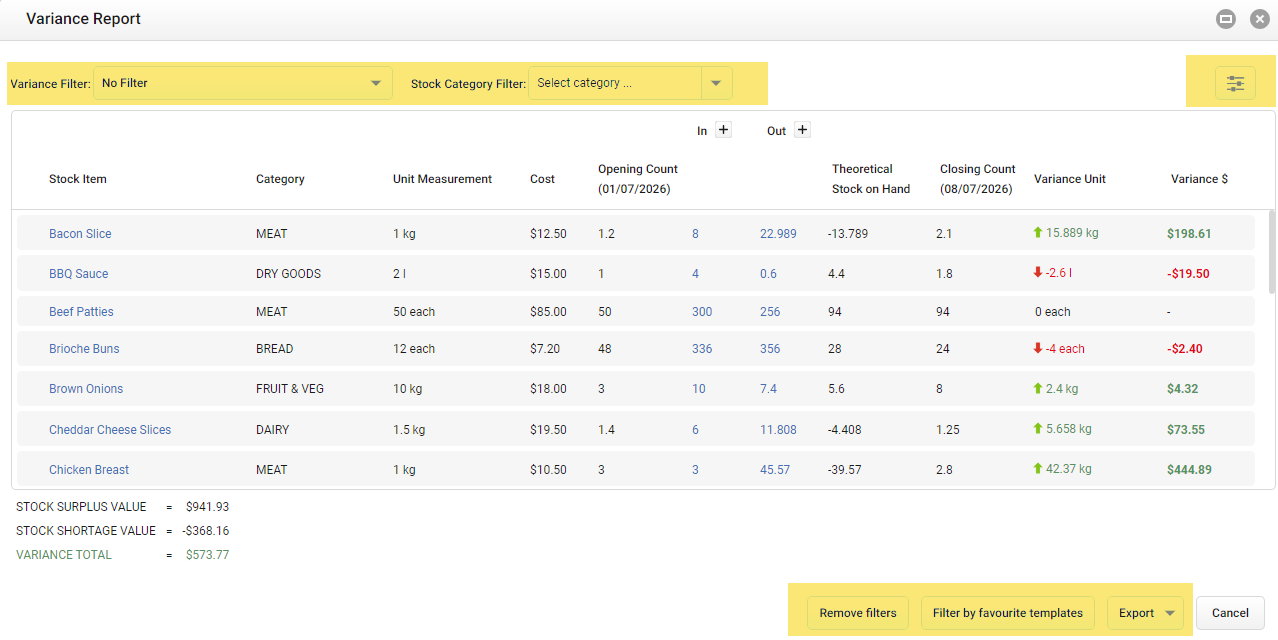
-
Click image to enlarge Variance Filter: Filter stock items based on variance status
- No Filter (default): Displays all stock items
- Surplus: Items with a stock surplus- More than expected
- None: Items with no variance
- Shortage: Items with a stock shortage - Less than expected
- Stock Category Filters: Display items from a specific category
- Report Settings (slider icon): Adjust the Variance Report settings that were applied when the report was first generated
- Remove Filters: Clear all active filters
- Filter by Favourites Templates: Create and apply custom stock filters
- Export: Export data to Excel alphabetically, or grouped by category
Base Products
When using Base Products, the Variance Report will display the aggregated total of stocktake counts, incoming and outgoing records for that group on a single line.
You can see exactly what makes up the total by clicking the + icon next to the Base product name. This will show you a detailed breakdown of:
- Individual Stock Items: The supplier items that contributed to the total in their original unit measurement
- Base Product Item: Any values assigned directly to the Base Product itself, rather than a specific supplier item. These are clearly marked with
[Base Product]in the description.
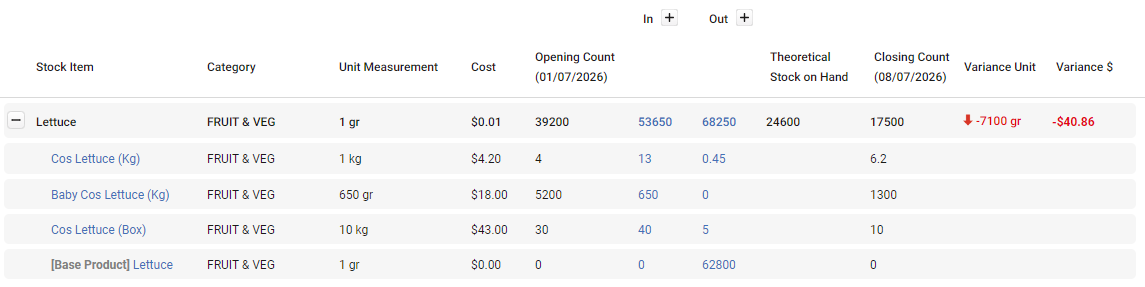
Click image to enlarge Because different items in a Base Product might be ordered or counted in different units, the report handles the math for you.
The aggregate line total automatically converts all the individual items into the same unit measurement set for the Base Product.
You can find our more about Base Products by clicking here!
Production Recipes vs. Countable Recipes
How different recipe types are displayed and tracked on the Variance Report.
Production Recipes
When a recipe is converted to a Production Item, the system treats it as a standalone, physical stock item.
- How it appears: The recipe will show up on the report as its own item
- Stocktake Counts: Counts are attributed to the recipe item itself
- POS Sales: When linked to a Sale item, this will decrement the Production Recipe Item, not the ingredients within the recipe. Ingredients within the recipe can only be decremented through Production Records.
Countable on Stocktake Recipes
When a recipe is converted to Countable on Stocktake, you can count the recipe on your Stocktake, but it will not appear as a Stock Item anywhere else in the system
- How it appears: The recipe will not show up on the report as its own item
- Stocktake Counts: Counts are attributed to the ingredients that make up the recipe
- POS Sales: When linked to a Sale Item, this will decrement the ingredients within the recipe
Find out more about how Countable Recipes are used in Calculations and Valuations by clicking here.