

Understanding the Dashboard
When a reporting period is still in progress, or there are outstanding items that require attention, the Health Check Dashboard will highlight completed tasks, outstanding issues, reporting progress, and your current COGS performance.
Finished Tasks
Tasks marked with a green tick have been completed and require no further action.
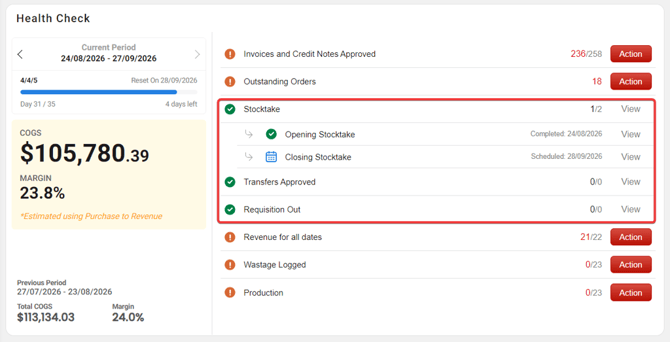
Select View to navigate directly to the relevant area and review the associated records if required.
Issues Requiring Attention
Highlighted items indicate issues that need to be resolved before the system can calculate your actual COGS result.
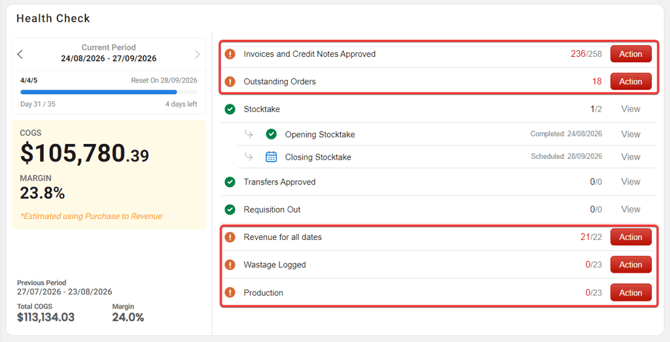
Select Action to open the relevant area in CTB and address the issue.
Once all outstanding items have been resolved, Health Check can provide a complete and accurate COGS calculation for the reporting period.
Period Selection and Progress Bar
The Period Selector is located in the top-left corner of the dashboard.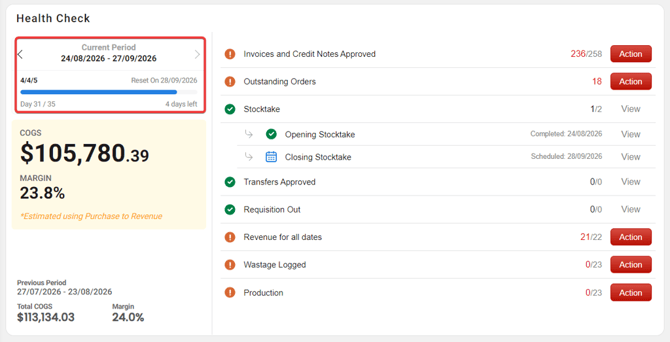
From here, you can:
- View the date range for the selected reporting period.
- Navigate between current and previous reporting periods.
- Track progress through the current period.
When viewing the current period, a progress indicator displays how many days have elapsed and how far through the reporting period your venue is.
COGS Valuation
The estimated COGS Valuation section is displayed in the centre-left area of the dashboard.
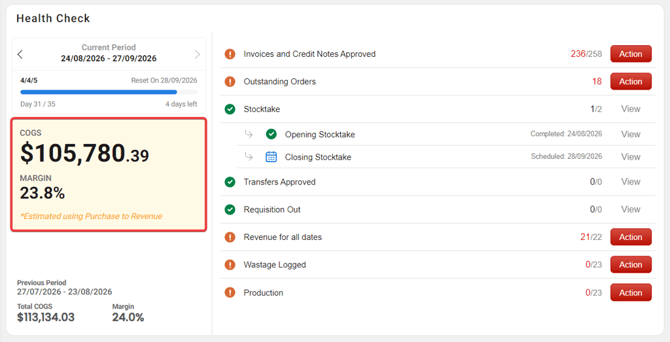
Your COGS is shown as both:
- A monetary value
- A COGS percentage margin
Estimated COGS
If there are still incomplete tasks or unresolved issues within the reporting period, Health Check will display an estimated COGS value.
This estimate is calculated using your Purchases and Revenue data and provides an indication of performance while records are still being completed.
Actual COGS
Once all Health Check requirements for the period have been completed and all indicators are in a healthy state, the estimate label is removed and an Actual COGS Value is displayed.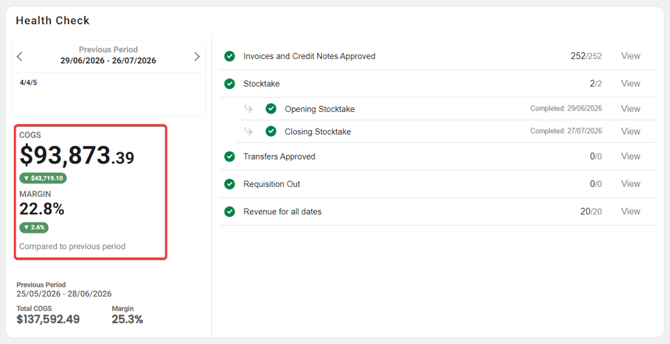
This represents the final COGS result for the reporting period based on completed and validated data.
Period-on-Period Comparison
When actual COGS values are available for both the current and previous periods, Health Check displays visual indicators showing whether COGS performance has improved or declined compared to the previous reporting period.
Previous Period COGS
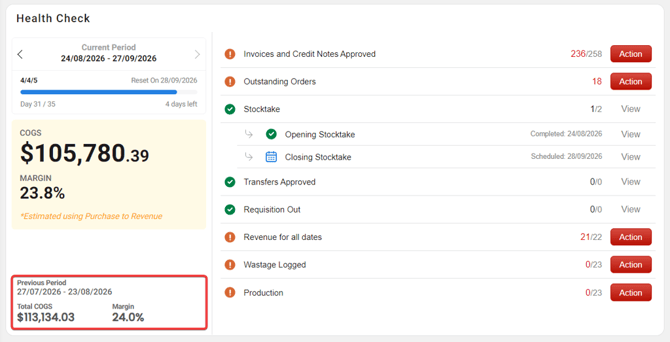
The Previous Period COGS section is located in the bottom-left area of the dashboard.
This section provides a summary of the previous reporting period, including:
- The reporting period date range
- Total COGS value
- COGS margin percentage
This makes it easy to compare current performance against previous results at a glance.